How to use pivots
Pivot is the basic tool for summaries and statistical analysis of the data. They can be written in schema, as explained here, but can be also used by every user directly form the table view.
Entering the pivot editor
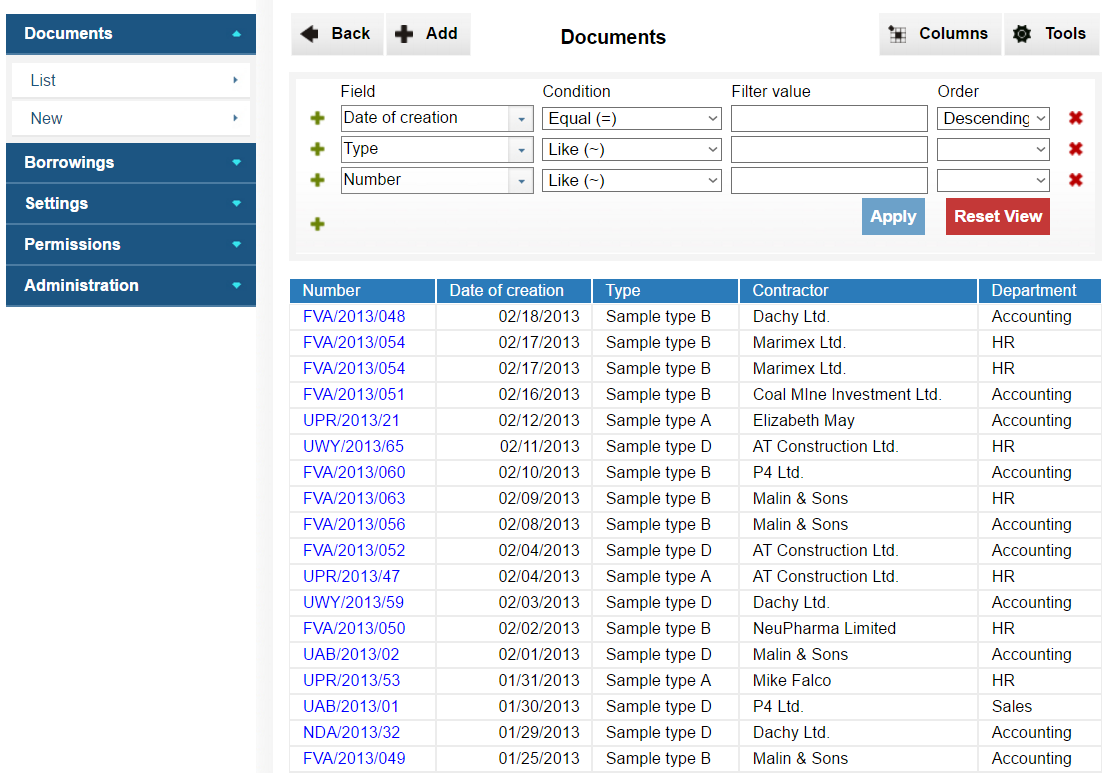
Pivot editor is available in every table or view and every user can use it. It is important to know that the pivot tables take into account row access control, so the reports may vary depending between users, depending on their permissions.
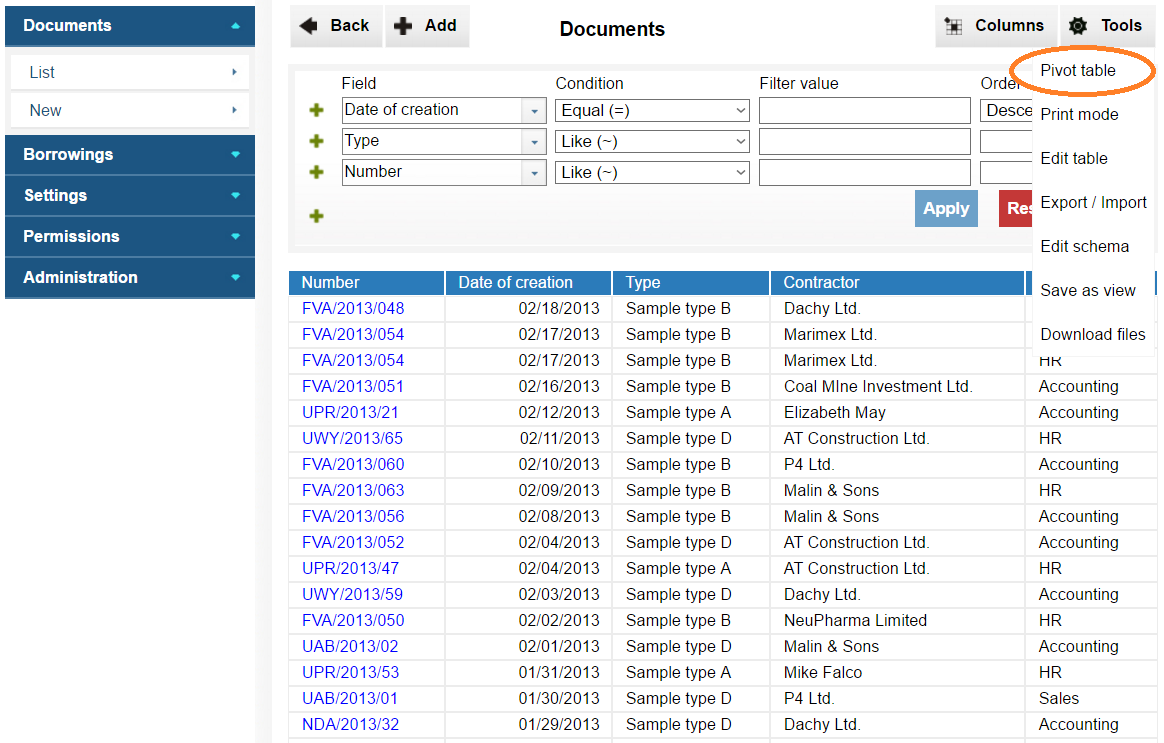
Pivot editor is accessible in the Tools menu in the upper right corner (Pivot table). Clicking the button will lead you to the pivot editor for a table or view you are currently visiting. Note that the editor will automatically use the filters applied to the table. But it is possible to change them later in the pivot editor.
Overview of pivot editor
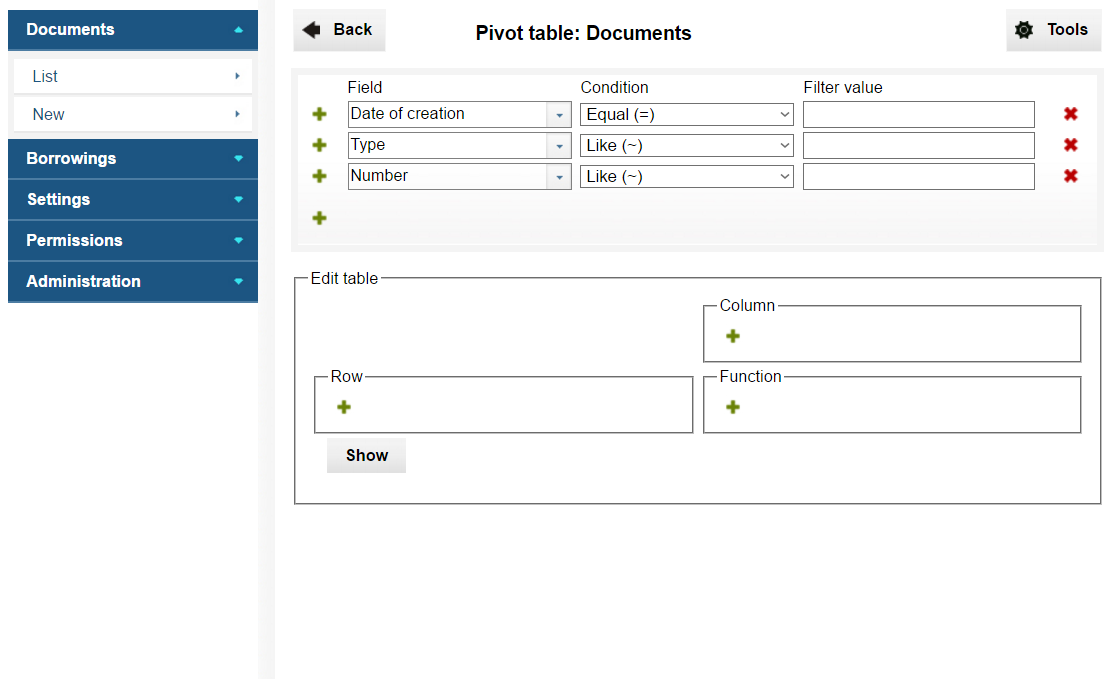
The pivot editor is composed of four parts:
-
Function is the only one obligatory element of pivot definition. It defines what to do with the content of selected column of the table/view. It is possible to set more than one function here.
-
Row let to set the column of aggregation. In other words, records with the same value in the selected column will be displayed (grouped) in one row. It is possible to set many row here, so the aggregation will be hierarchical.
-
Column section work similar as the row section. The only difference is that the result of aggregation will be displayed in columns, not rows.
-
Filters work in the same way as in table view, except the order parameter. When you enter the pivot editor, the set of filters displayed here is copied from the table view. You can modify these filters, add some new or remove completely.
Setting the function
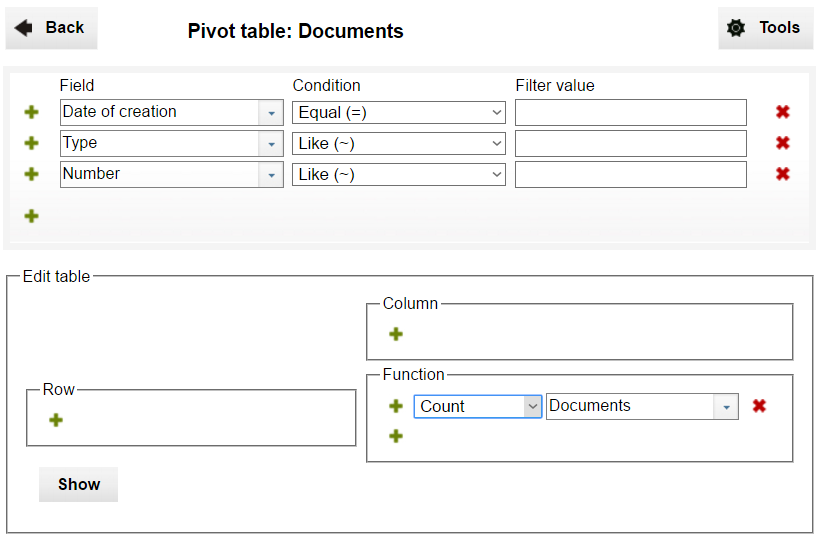
In the first step we will set the function for the pivot report. To ad a function, click on the green plus mark.
The function parameter is composed of two parts: the function itself and the column to be given to it.
Currently the following set of functions can be used in InstaDB:
-
Count,
-
Count distinct,
-
Sum,
-
Average,
-
Minimum,
-
Maximum.
As the data do not contain any numerical values, we will use the Count function. This function simply counts the records, so it does not matter which column we choose.
When a function is selected, we can see the resulting report by clicking on the Show button.
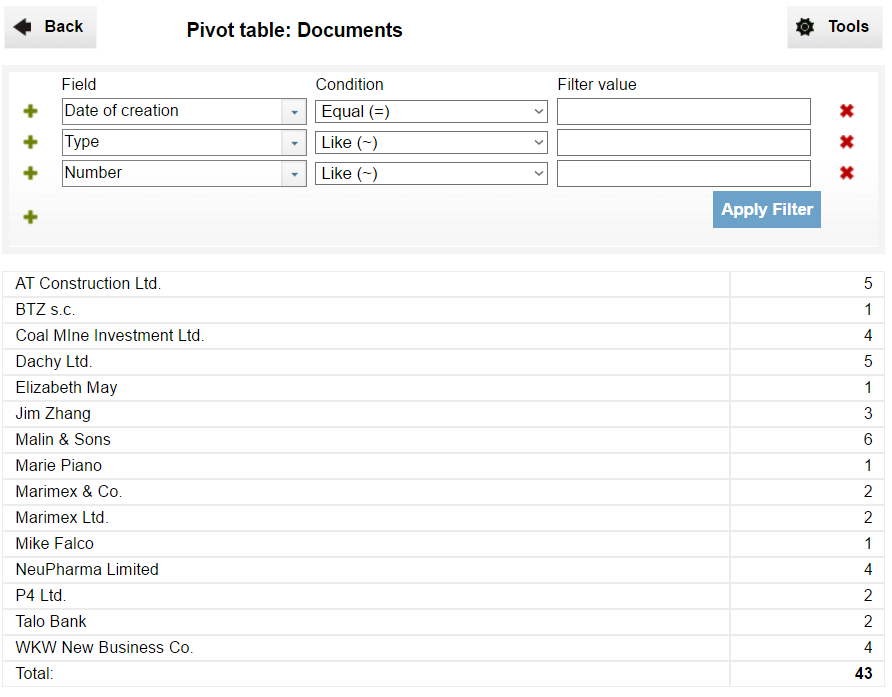
The result is extremely simple. It shows only one number, in this case it is a number of all records fulfilling the criteria of the filters. Note that the filters are displayed above the result and you can modify them without returning to the editor.
Now we will make the report a bit more interesting. Click the Back button above the filters to go back to the pivot editor.
Setting the row
As every document in our sample data is described by a Contractor column, we may us it as an aggregation parameter and check how many documents is assigned to every contractor.
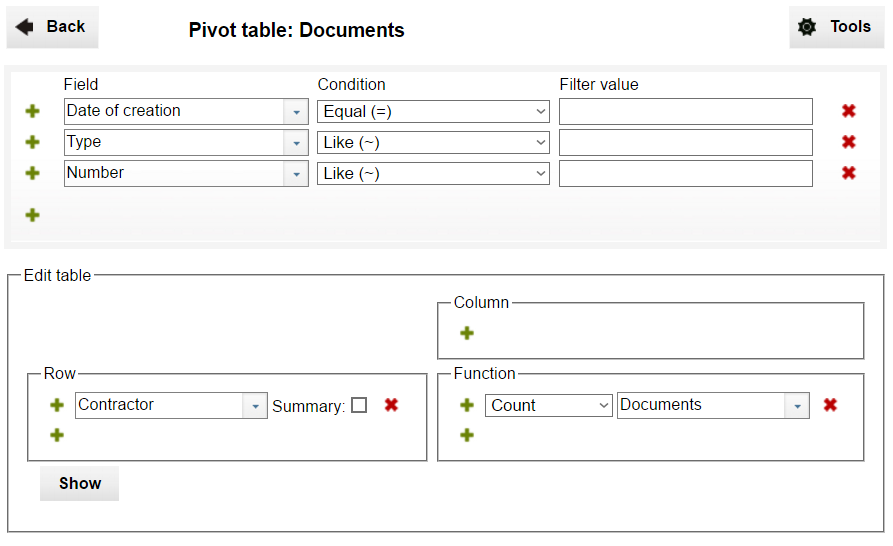
To do so you need to click the green plus button in the Row section and select the Contractor column.
On the right of the column selector is a Summary checkbox. We will leave it empty for now.
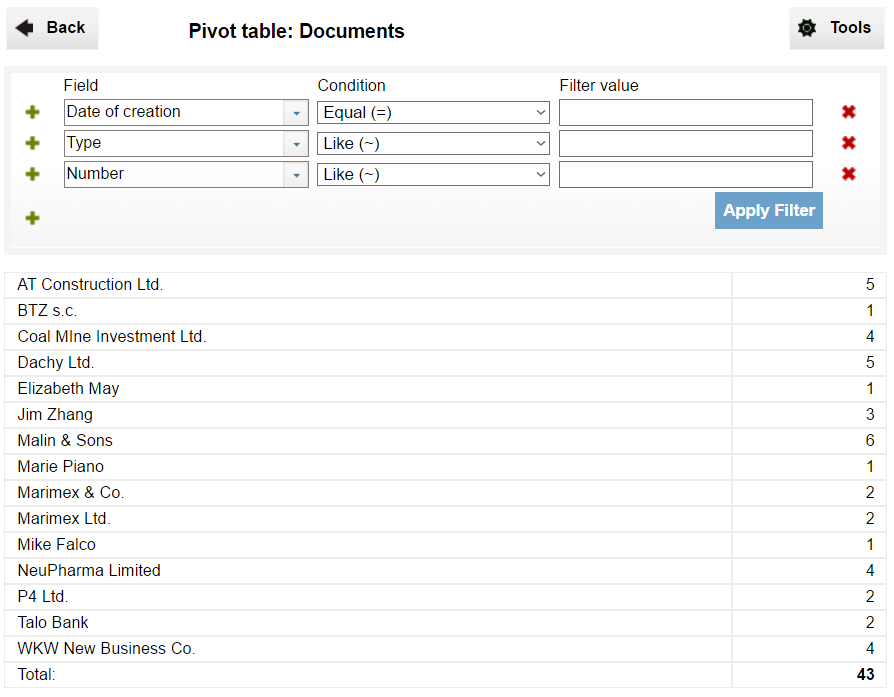
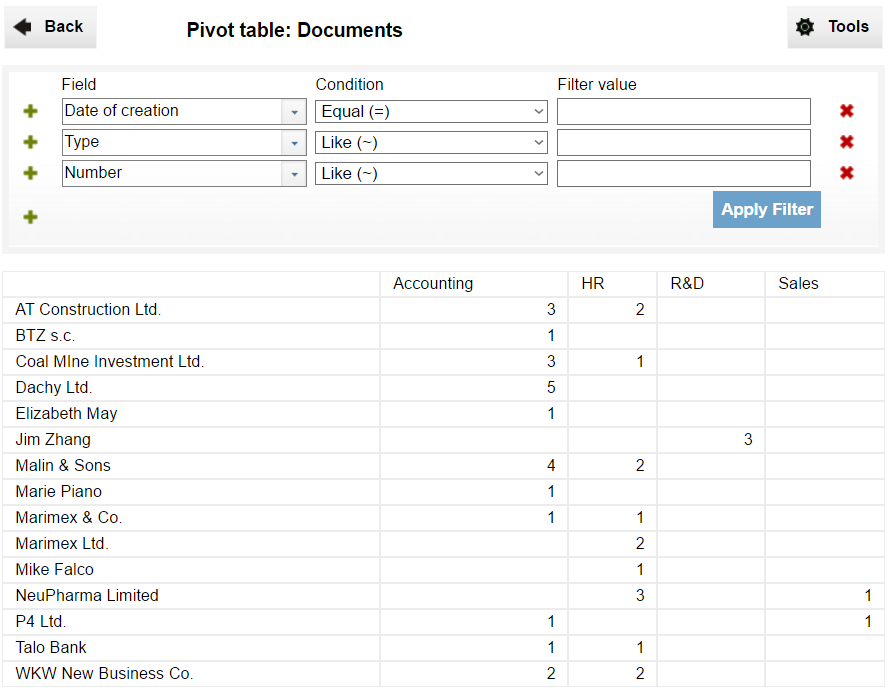
After pressing the Show button you will see, that our report has changed. Now there are a few rows, one for each contractor. And every row presents a number, which represents a number of documents assigned to the contractor.
The last row of the report shows the total number of documents of all contractors.
Now we will ad a column. To do so click the Back button.
Setting the column
Now we can proceed with our data analysis and use another dimension to the report. Every document is assigned to a department, which we can use.
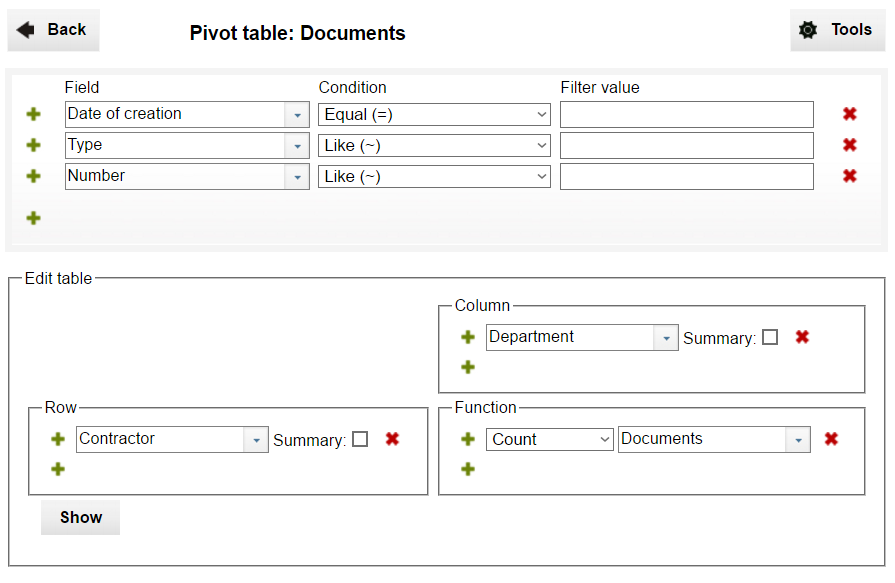
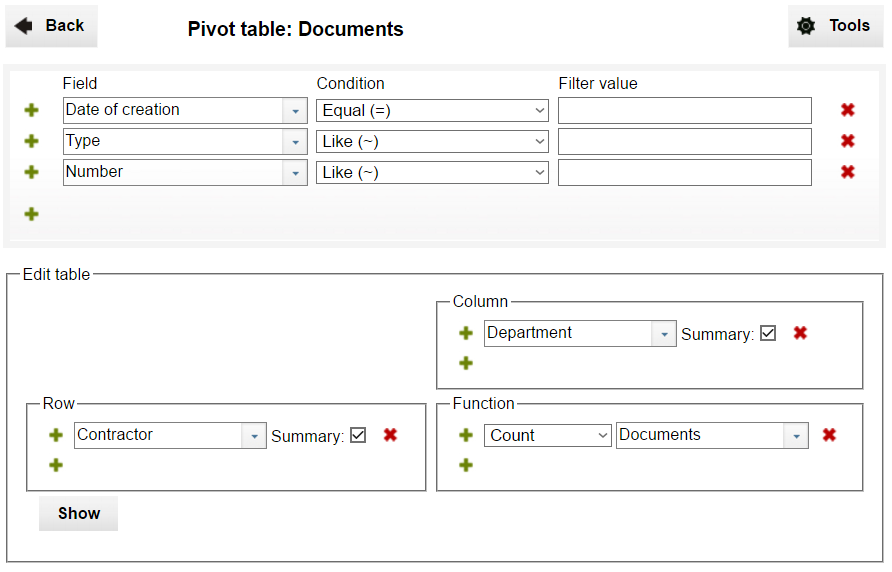
To add a column, click on the green plus button and select the Department in the selector. The Summary button on the right leave empty for now. And finally click the Show button.
The report shows now a matrix of contractors and departments. Numbers in every cell shows the total number of documents assigned at the same time to a contractor and a department. The empty columns indicate that there are on documents described by such combination of department and contractor.
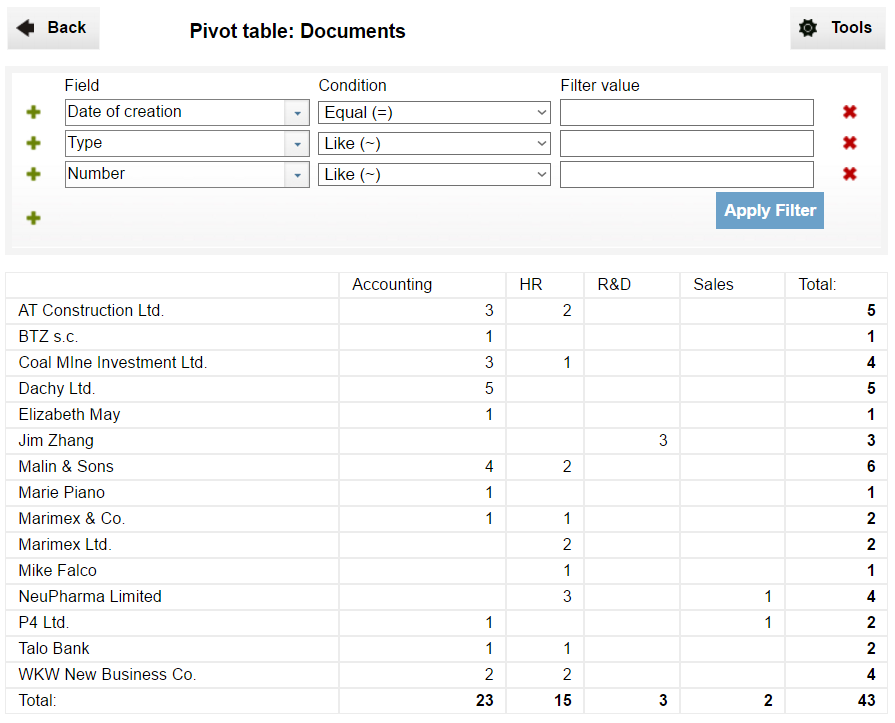
Now use the Back button to return to the pivot editor and check both Summary checkboxes (one in the Column section and one in the Row. And press the Show again.
This time the report is extended with one extra column and one extra row. They shows the total number of documents in particular departments and assigned to particular contractors. And their intersection shows the total number of documents in the report.
This is not the end. We can co a bit further with the report. So, click the Back button again.
Advanced reports
As mentioned at above, it is possible to set more than one column, row and function in a single pivot report. So now we will add additional row to demonstrate how it works.
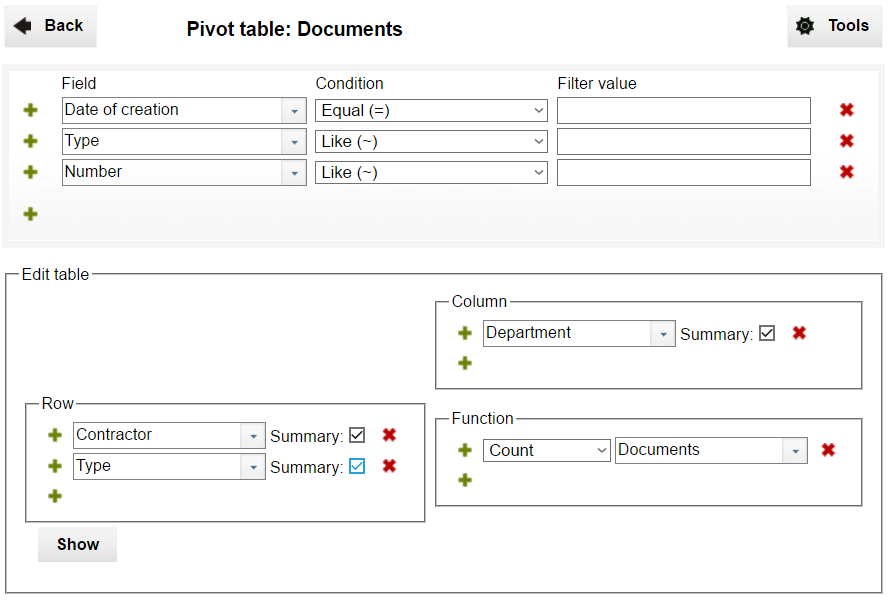
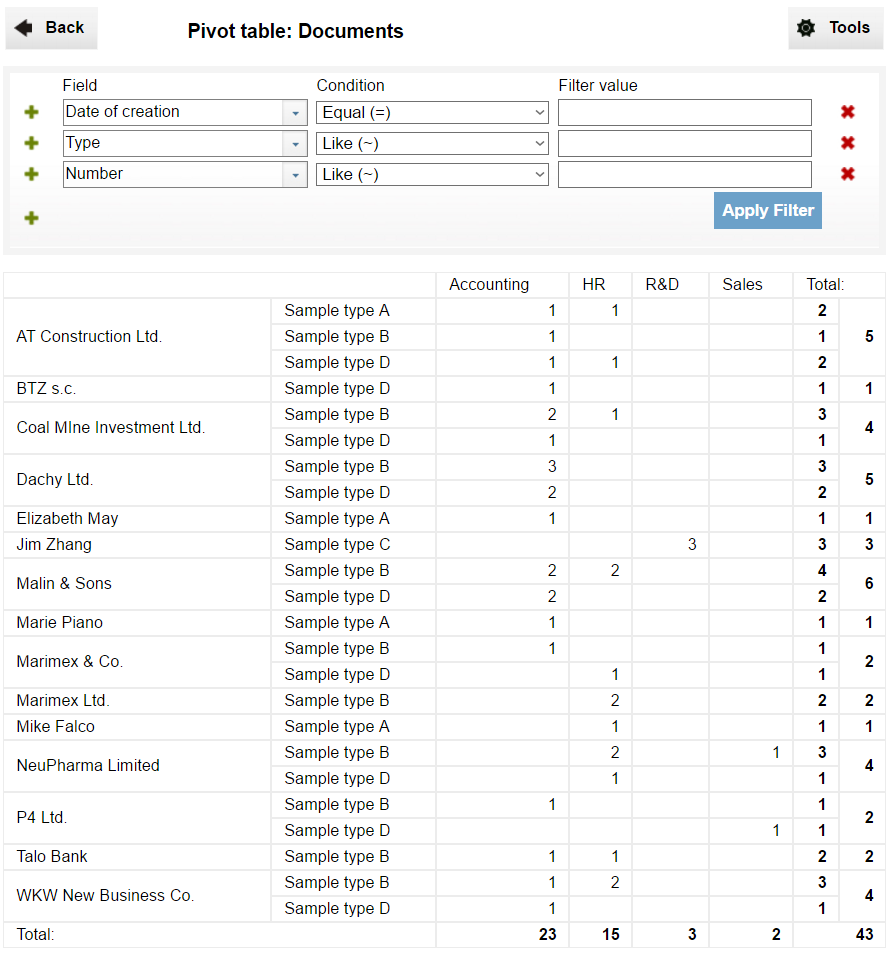
To add an additional row click on the green plus button below the Contractor in the Row section. Then select Type, check the Summary and press the Show button.
Now the records are grouped by two parameters in rows. First they are grouped by the contractor, and then all documents of a given contractors are grouped by a document type. If you would like to group them in the reverse order (i.e. type first, contractor last), you should change the order in the group section in the pivot editor.
Note that the Total column is divided in two. One part shows the total number of documents of a given type related to a particular contractor, the second shows the total number of documents of the contractor.
Now you can go to the pivot editor to play more with the pivot reports.
Final information
It is possible to export a report to the CSV format. To do so, click the Tools button when the report is displayed and select the Export to CSV option.
If you are an administrator of the application, you can write the pivot definition to the application schema. This option is available in Tools in the pivot editor (Save pivot to schema).